
You can only sell to people willing to buy from you
Share of search is the closest thing you have to a live read on whether the people who will consider you are growing or shrinking, and your performance stack is built to miss it.
The instinct is to fix the media plan. The real constraint is upstream, in what the measurement system can see. Budget flows toward the demand your tools capture and away from the demand they miss.
Everything else in a marketing plan is subordinate to that. Category demand rises and falls for reasons outside your control, and even a buyer in market at the right moment converts nothing if you are not in the set of brands they will consider. That consideration set is the asset, and most boards have no live read on whether theirs is growing or shrinking. Share of search is the closest thing to one.
The whole thing fits in a line

The buyers available to you are the size of your category, times the share of it in market now, times the share willing to buy from you. The first term is the market, and it moves on its own. The second is timing, also outside your control. The third is brand, in the only sense a P&L cares about: the proportion of buyers who will consider you when they are ready.
It is the one term of the three you can move. And a search for a brand by name declares that brand is in that buyer's consideration set. Aggregate those searches across a category and you can watch the set move in near real time, on data you do not pay for. In our tests that movement led revenue by months, and Les Binet's IPA analyses find the same lead.
The one number your stack cannot show you
Reported ROAS captures the buyers who were already going to buy. It reads the bottom of the funnel, where the decision is mostly made. By the time someone clicks or walks into a store, McKinsey's work suggests around 80 percent of buyers already have a product in mind.
Share of search reads the other end. It is your brand's search volume as a share of the whole category's, and it moves before revenue does. The IPA Share of Search think tank, thirty case studies across twelve categories, found share of search correlates with about 83 percent of market share, and changes in it precede changes in market share by anywhere from a few months in fast categories to nine or twelve months in considered ones like automotive.
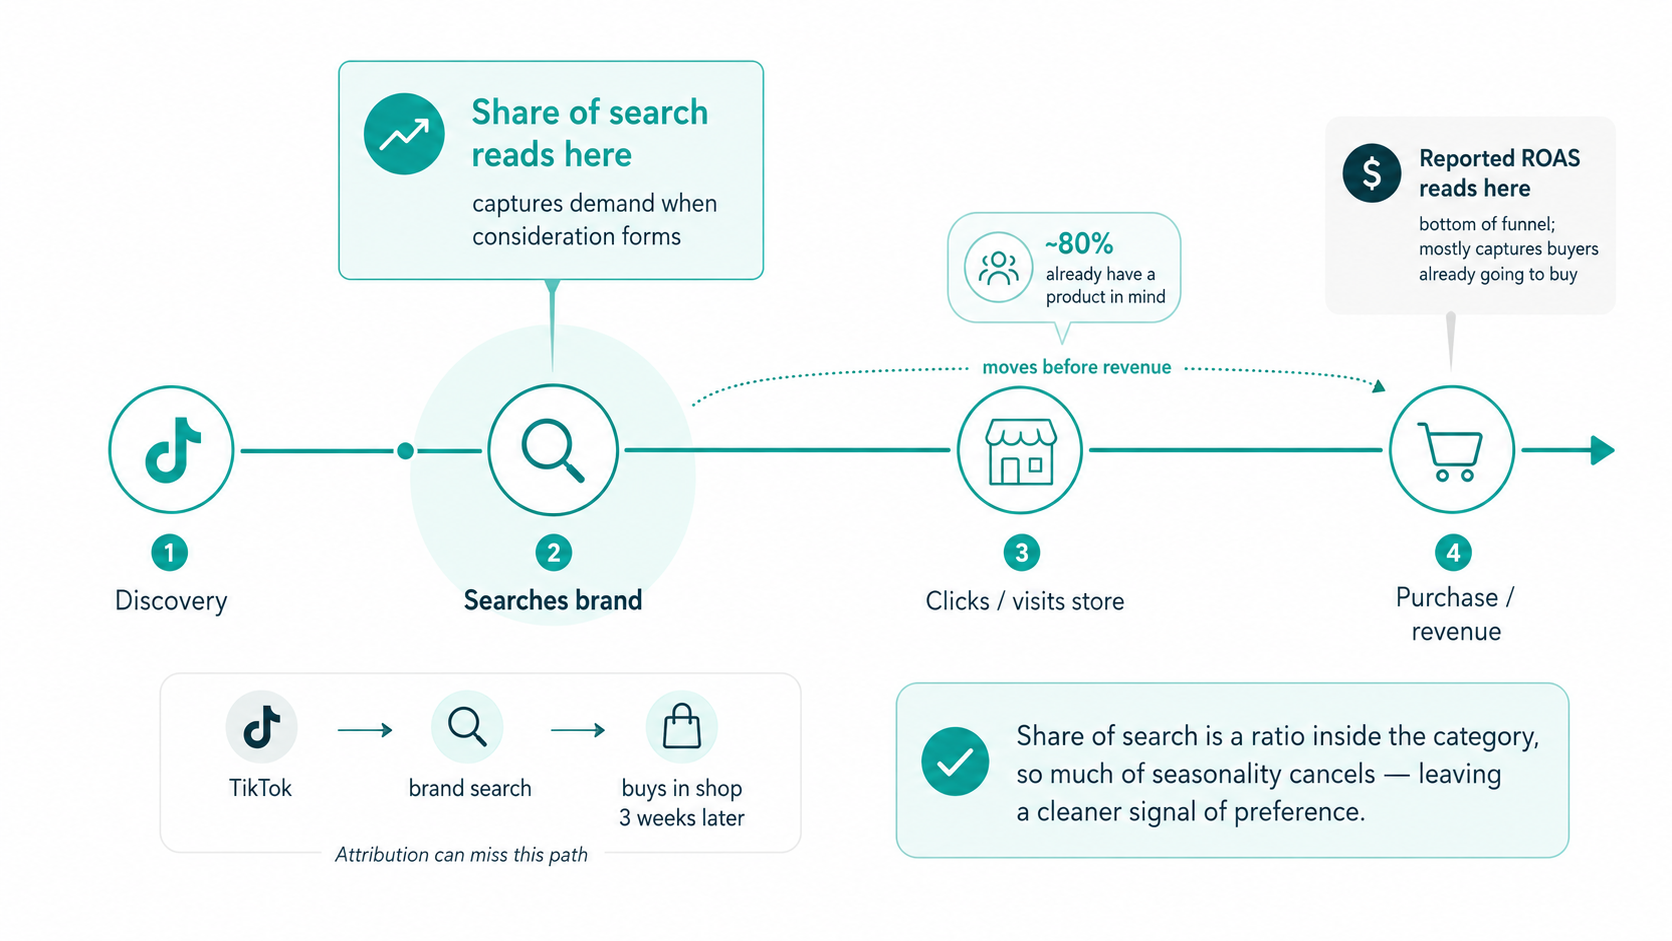
There is a second advantage that matters for anyone with offline or long-consideration sales. Someone sees your TikTok, searches your name, and buys three weeks later in a shop. Attribution sees none of that. Share of search sees the demand the moment it forms, regardless of where the purchase eventually lands.
And it controls for the thing raw search volume does not. Volume swings hard on category seasonality every year. Share is a ratio inside the category, so most of that seasonality cancels. What is left is closer to a real signal of preference.
What it actually shows you, layer by layer
Take Puma. It is not our client, but every number here is public, which is the first benefit worth naming: you can run this on any brand in your category.
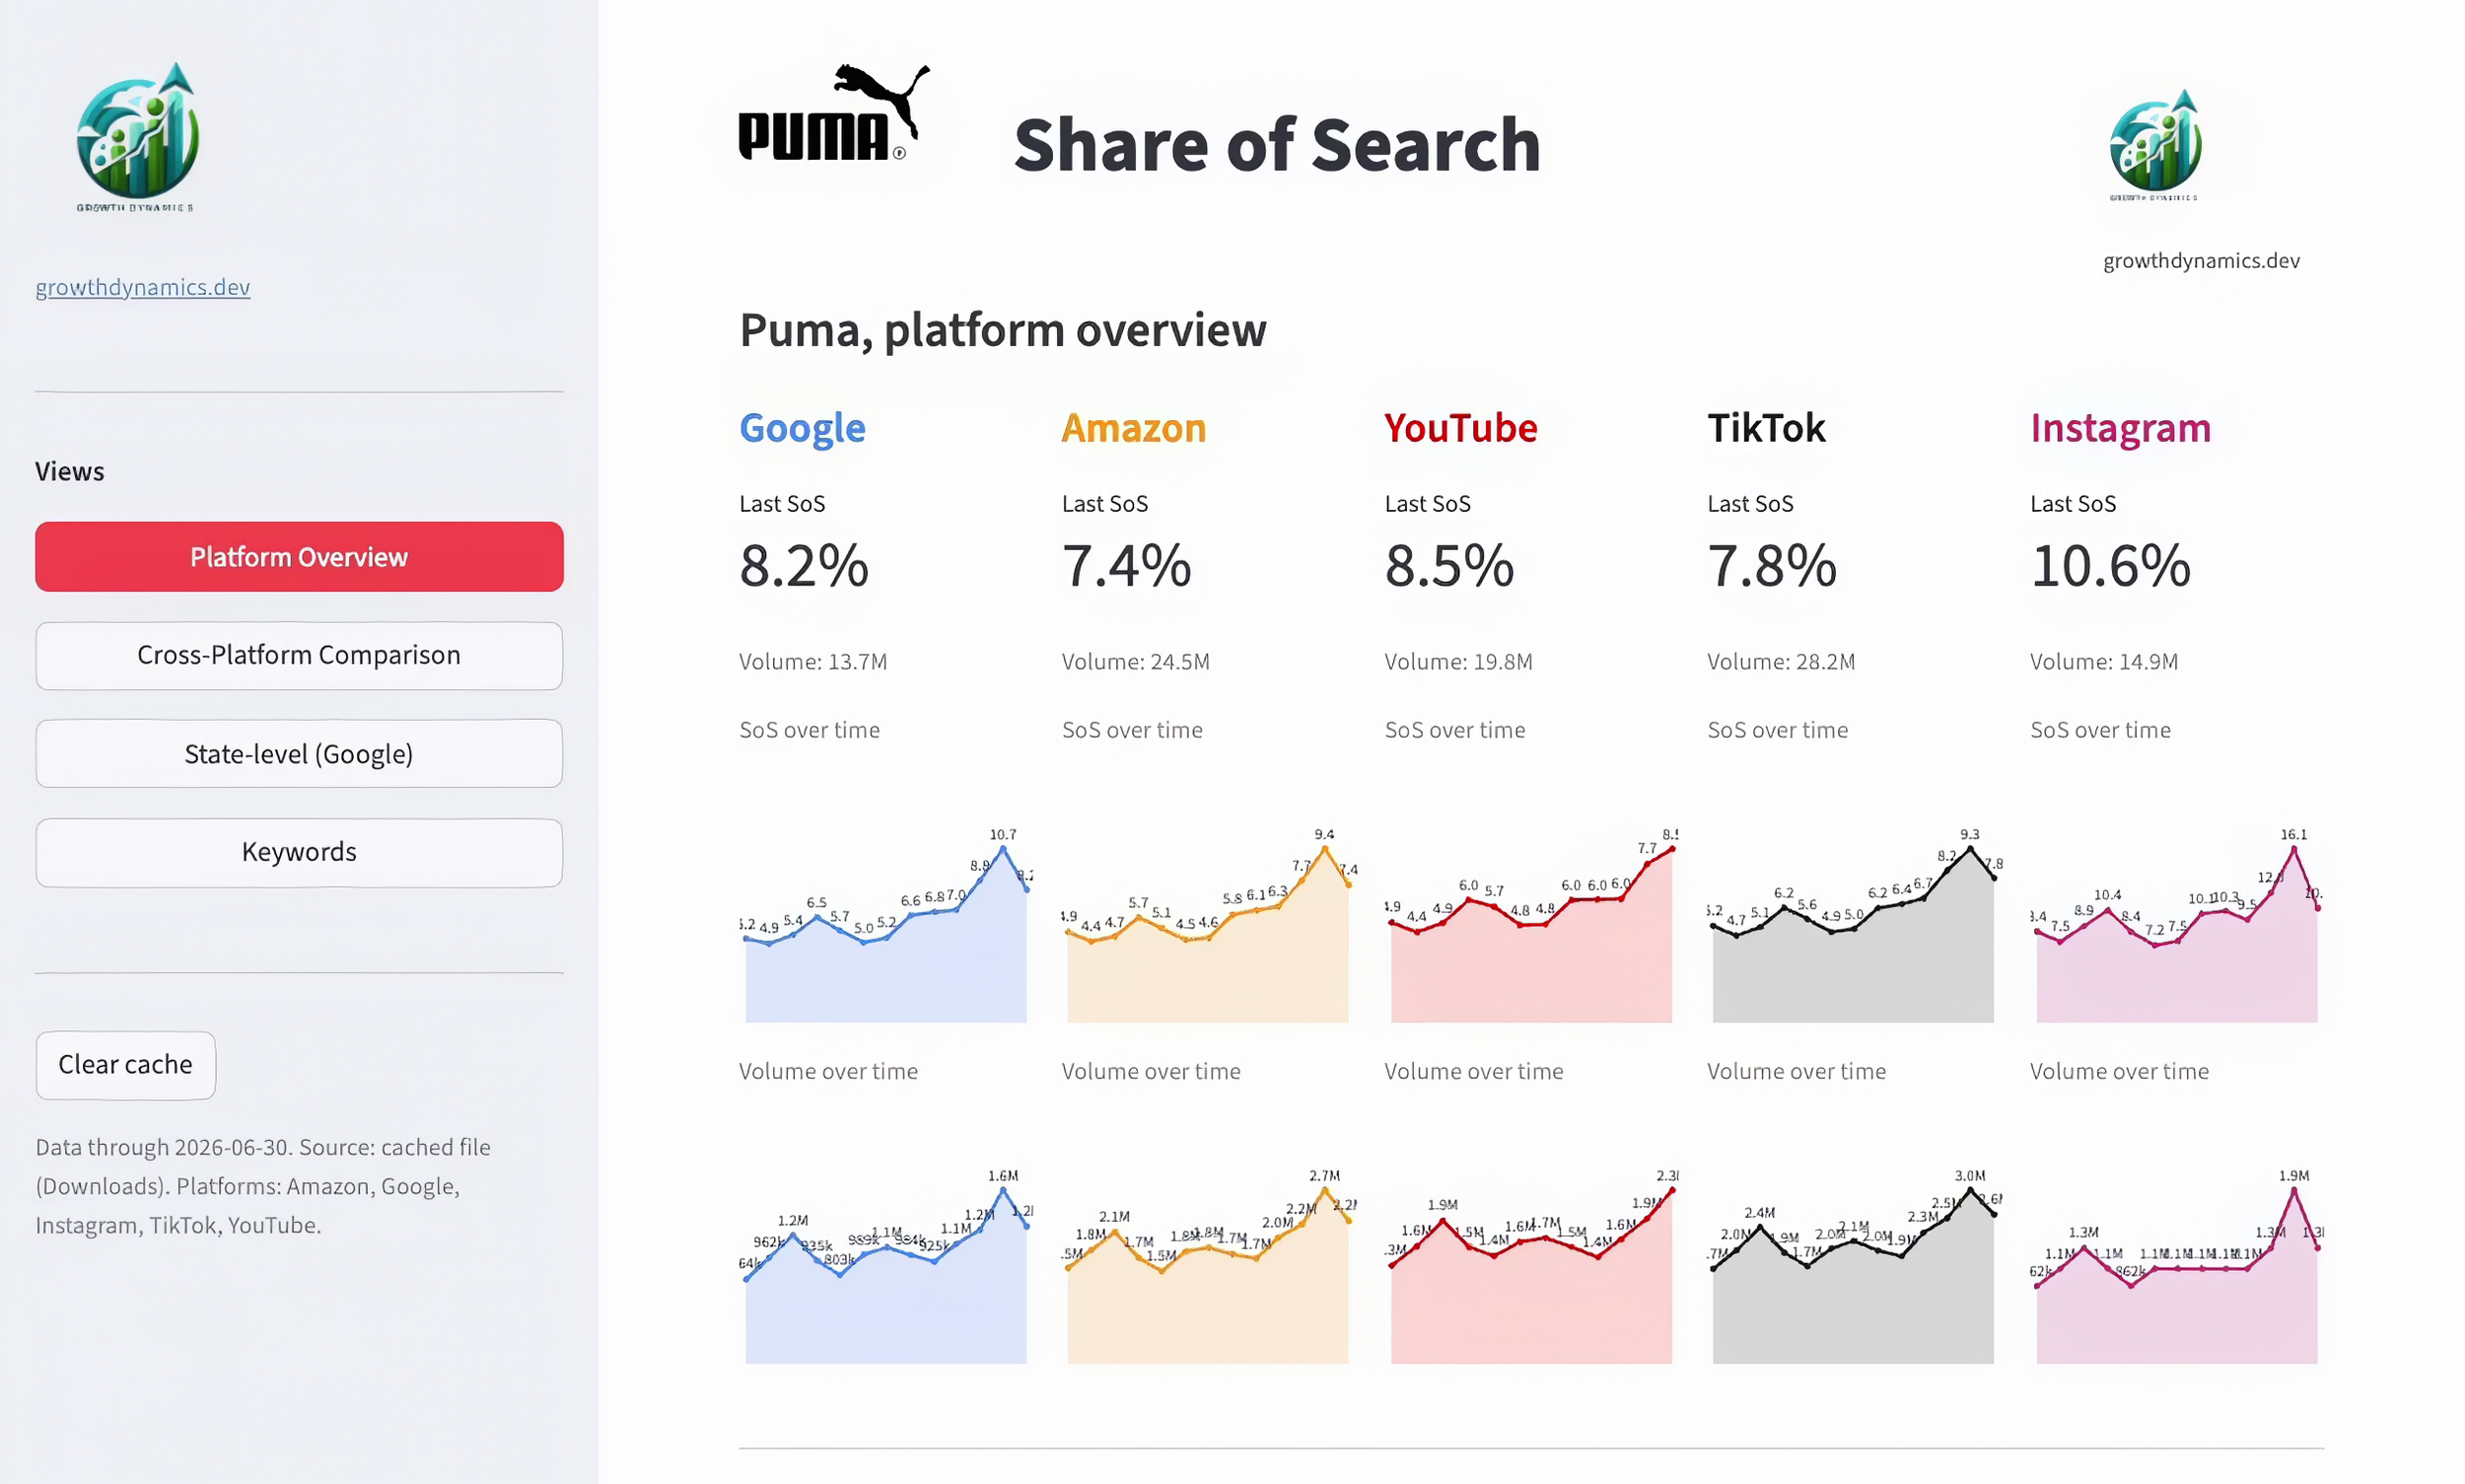
At the platform level, you can see demand before it converts. Search on YouTube, TikTok and Instagram is where people discover. Google and Amazon are where they buy. The discovery platforms move first and the buying platforms follow. When Puma's Instagram search softened, the dip showed up on Google and Amazon. Purely correlational here and additional work is required to prove the causality.
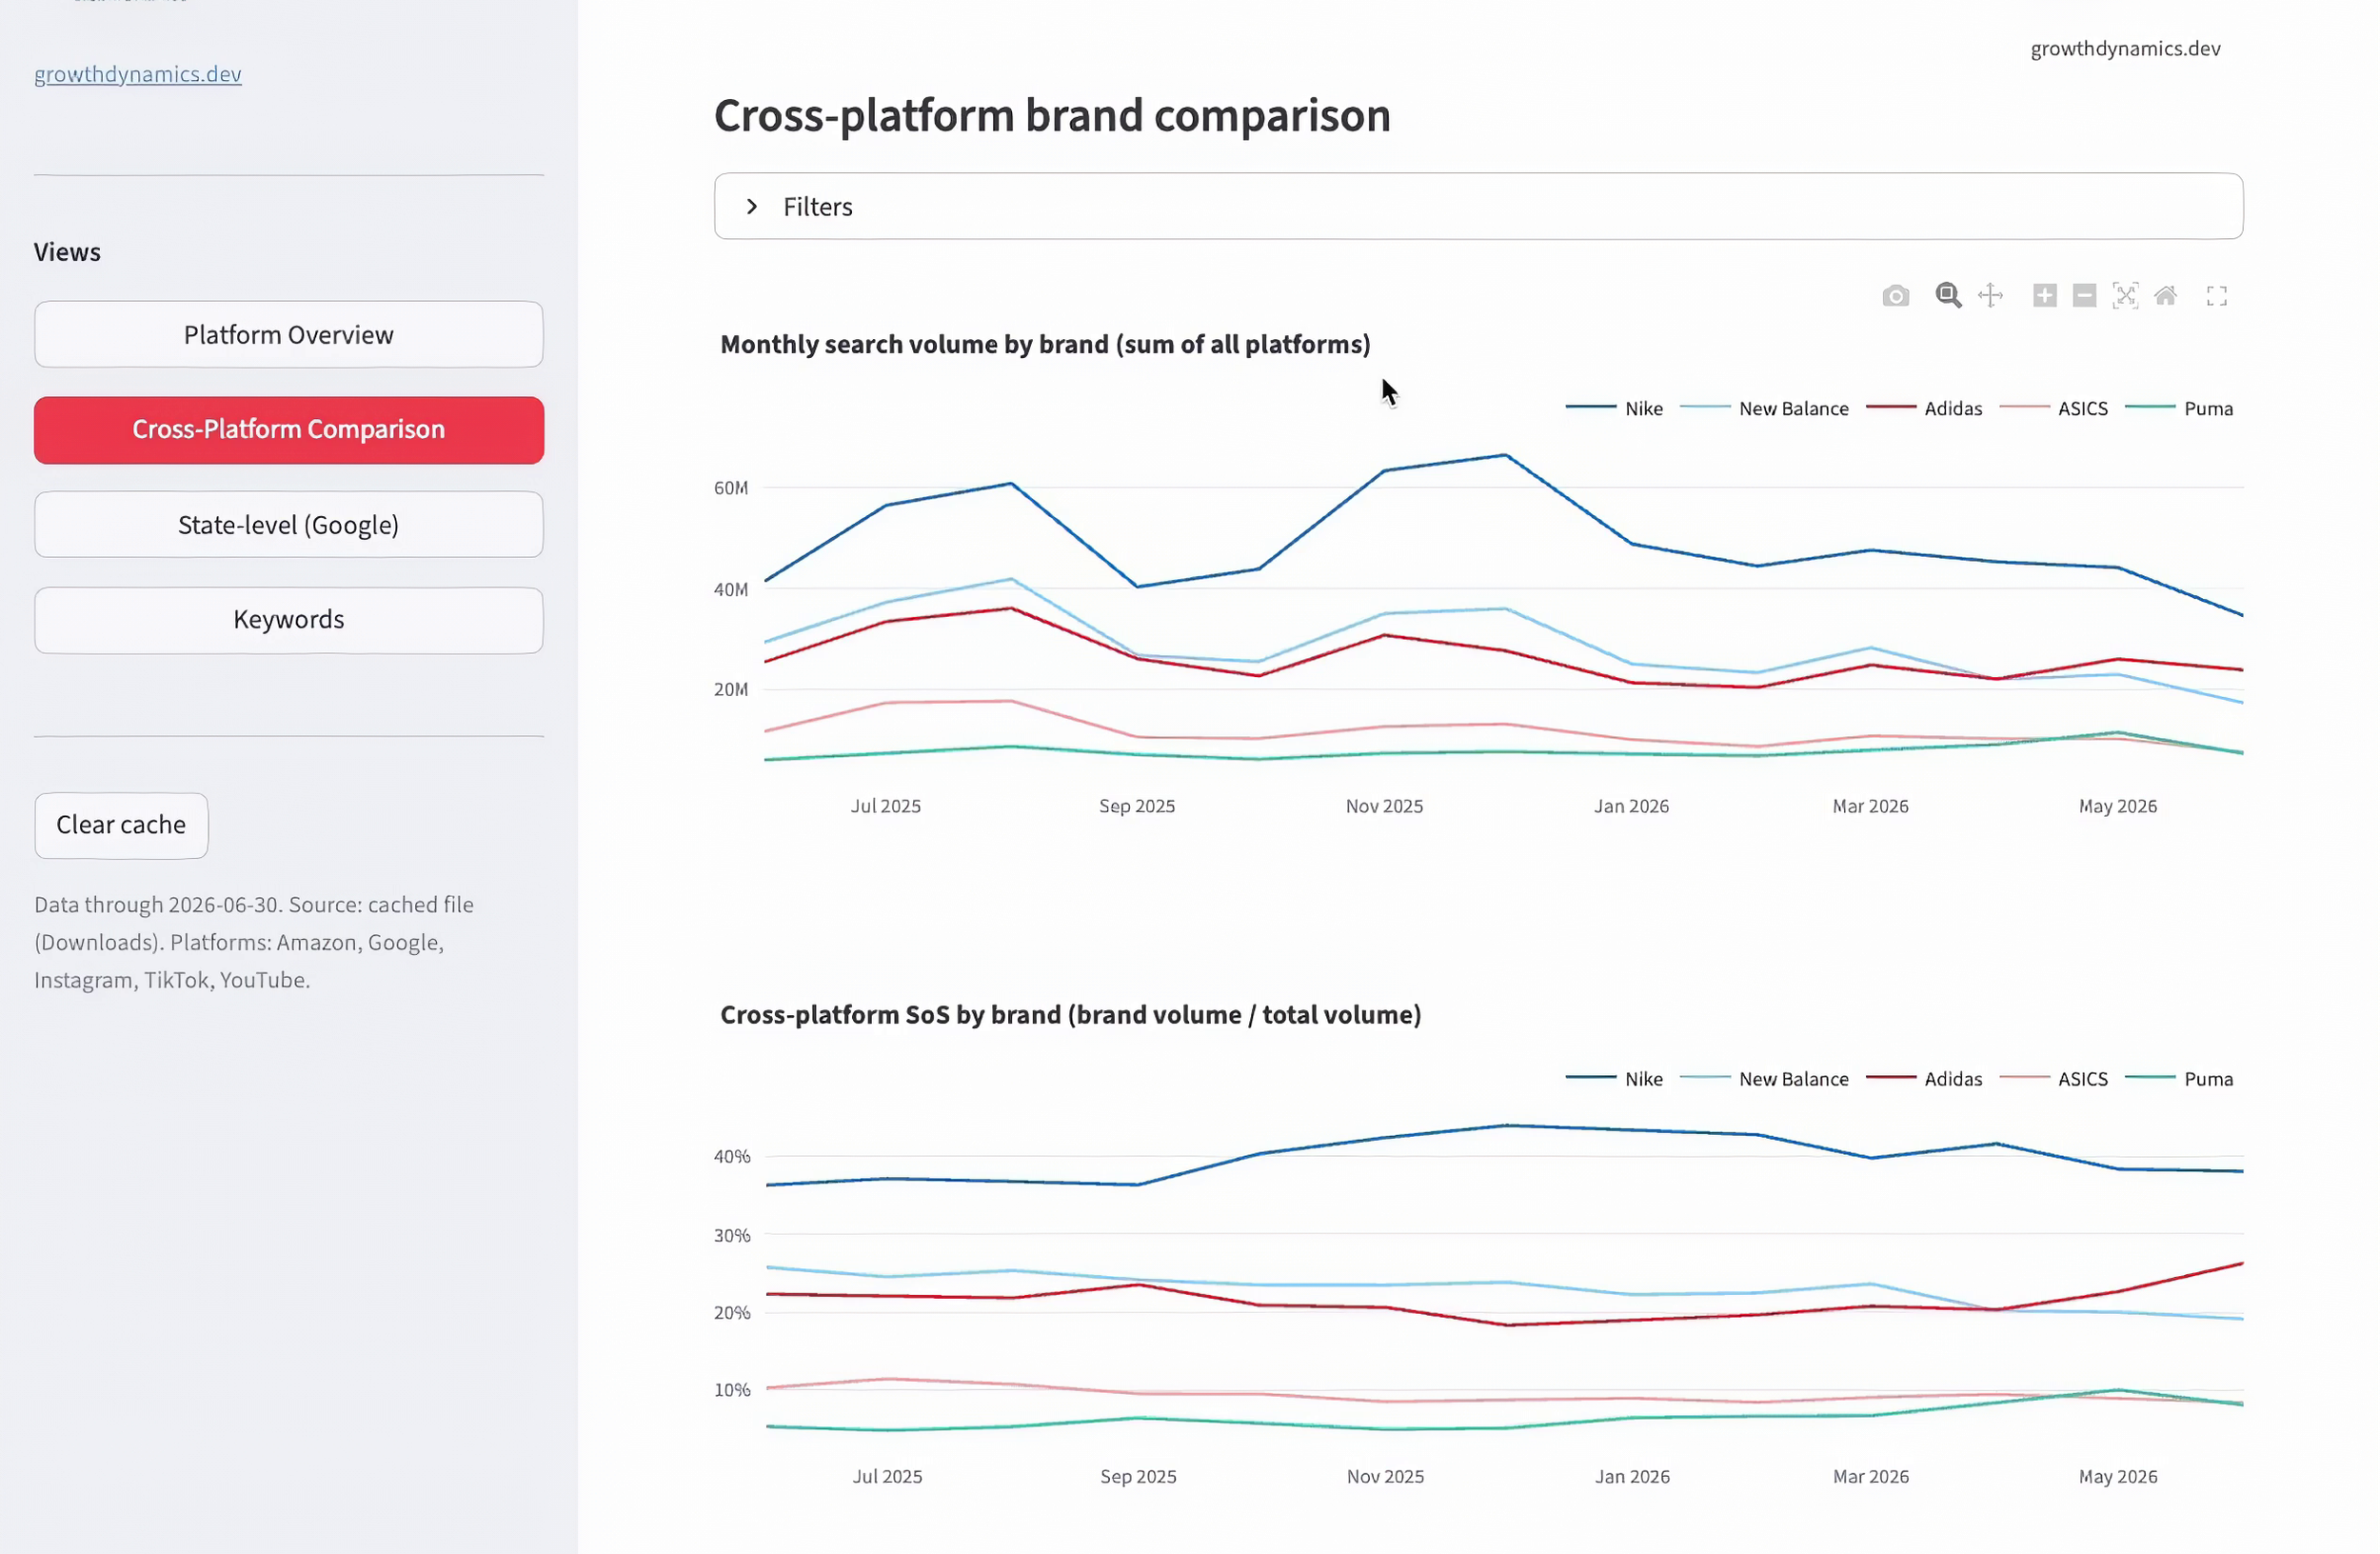
At the category level, you can watch the whole consideration set at once. Put Puma against Nike, Adidas, New Balance and ASICS and you are no longer looking at one brand in isolation. You can see whether your share is rising because you are winning or because the whole category tide is lifting every boat, and you can see a competitor shrink in real time. Nike in California fell from 51 percent of category search to 32. That is a consideration set being redistributed.
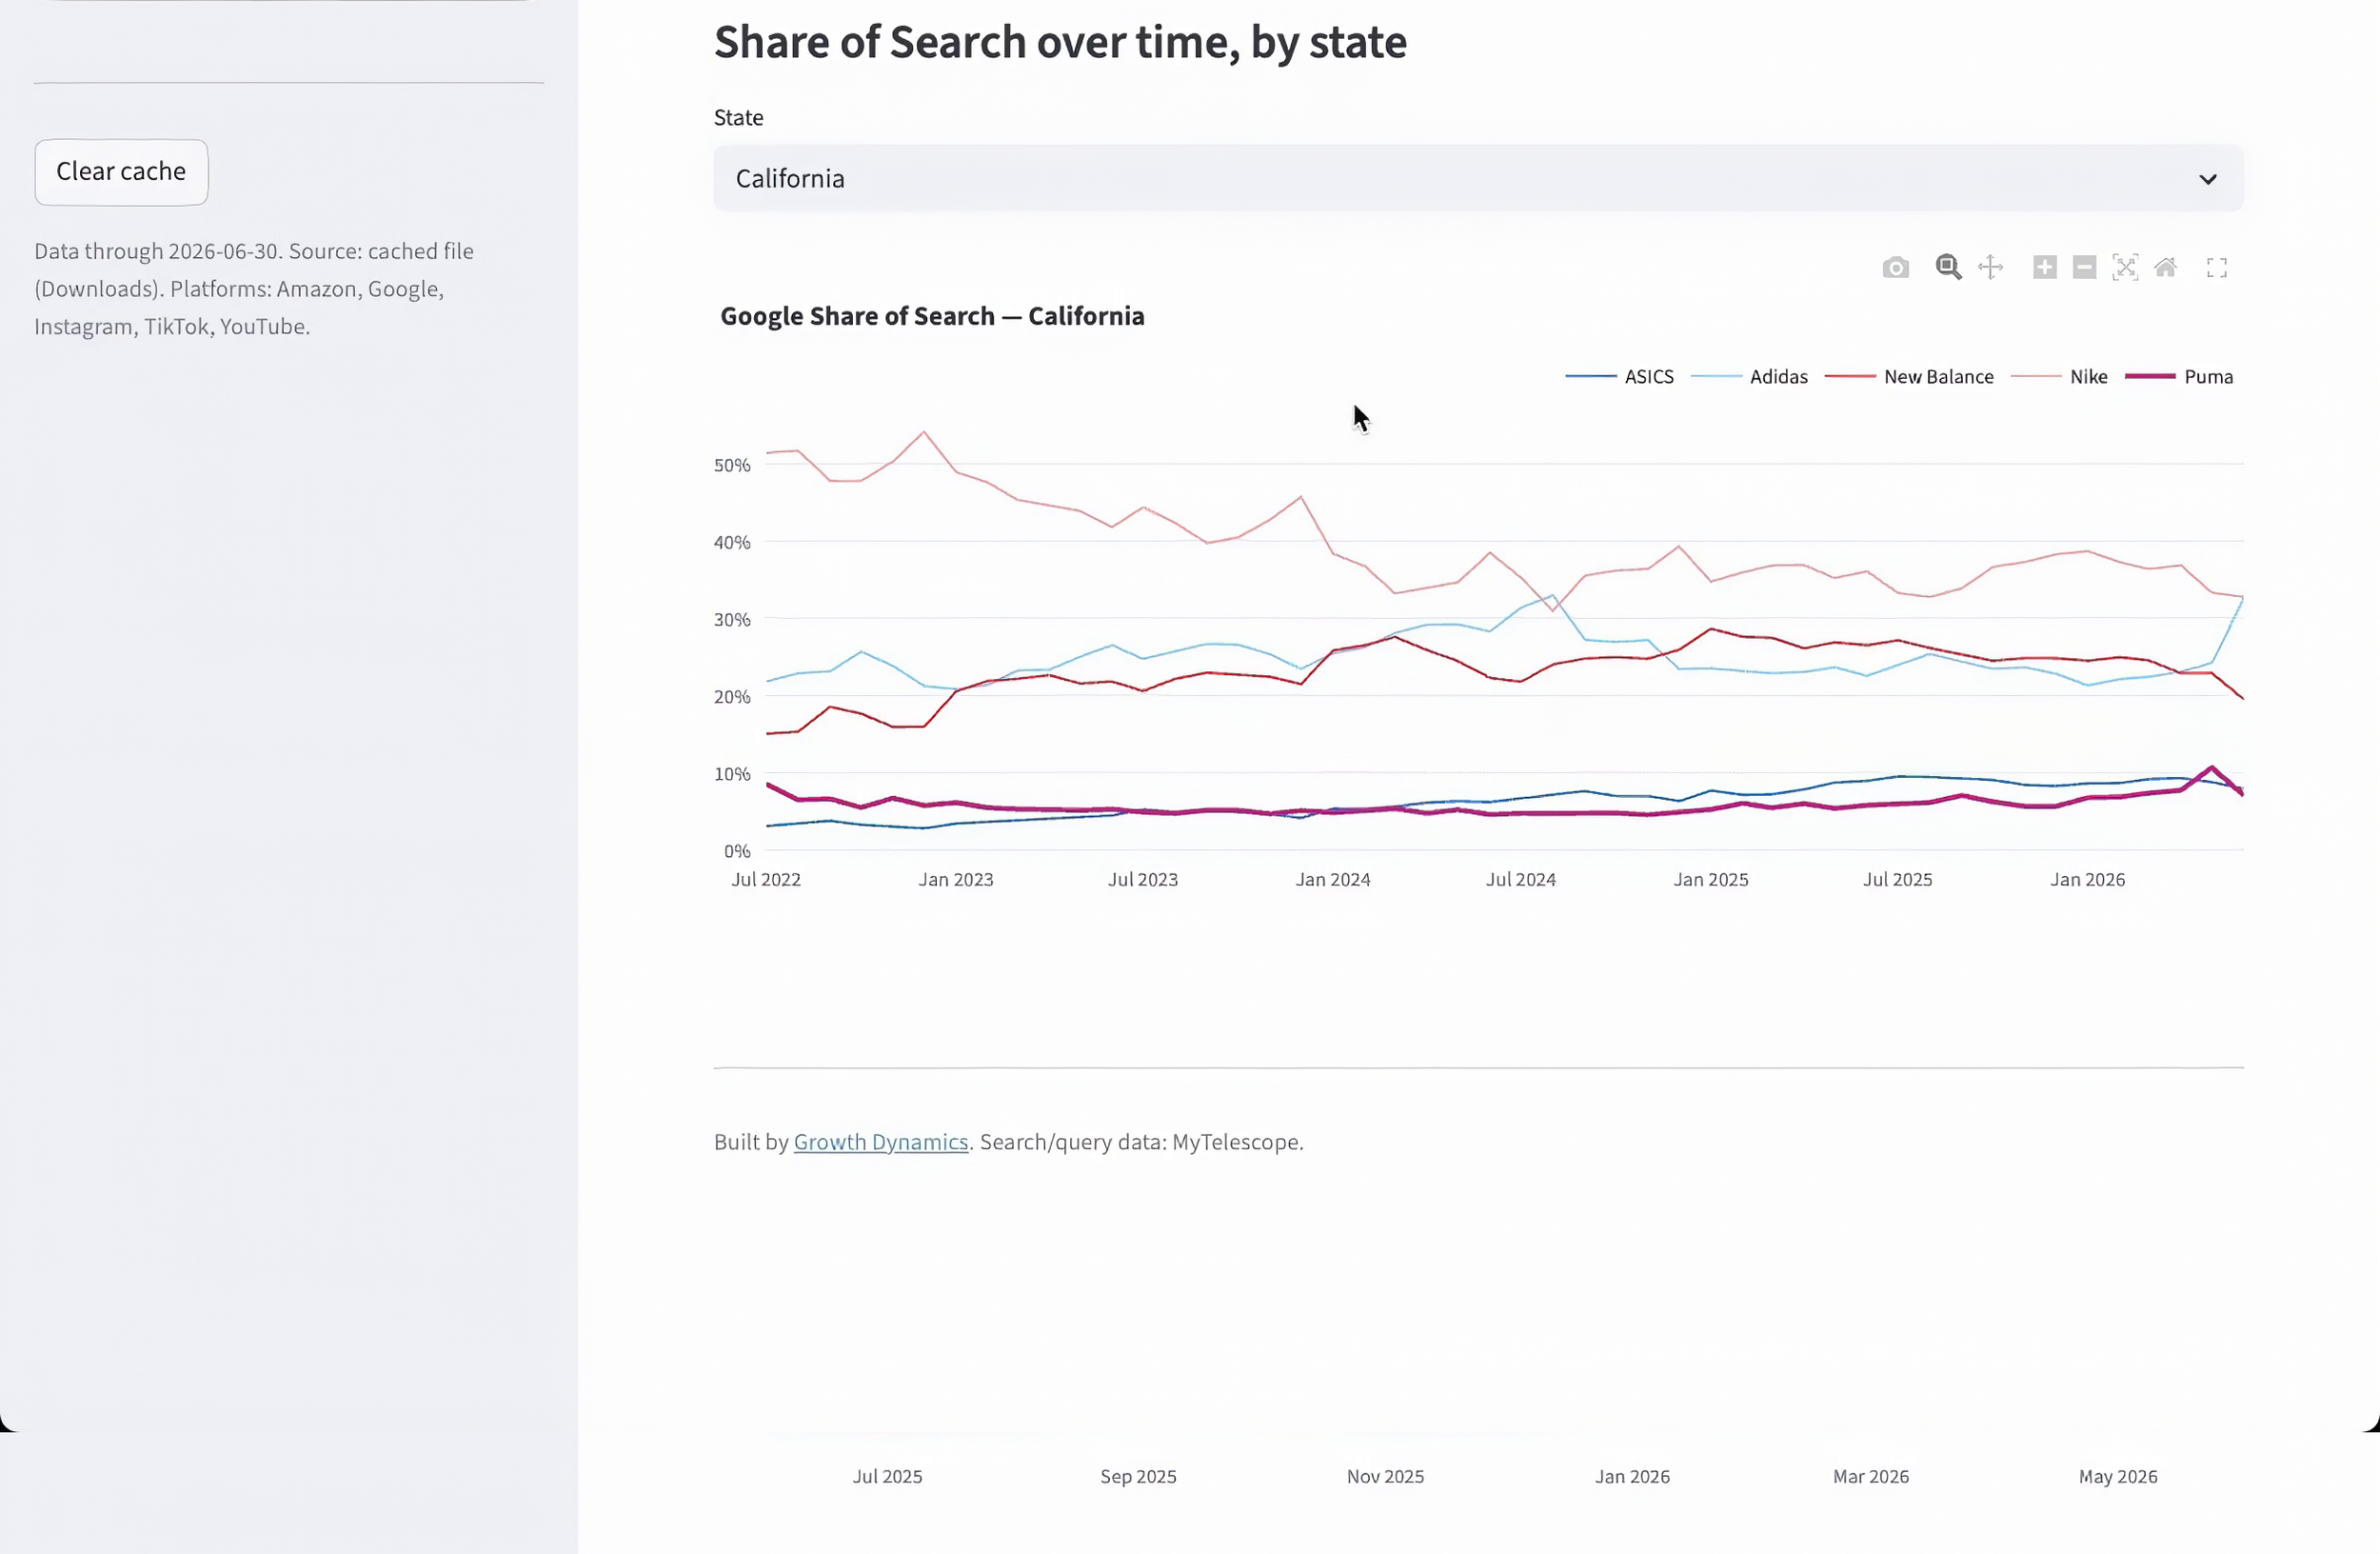
At the state level, you can find where growth is real and put money there. National averages hide everything. California's Puma share jumped 1.7 points in a year on 24 percent more volume, a large move off a small base. Georgia grew more slowly but steadily. Those are two different situations that call for two different decisions, and you only see the difference at the geographic level. A single spike can be an event; sustained growth in a region is a demand shift you can back.
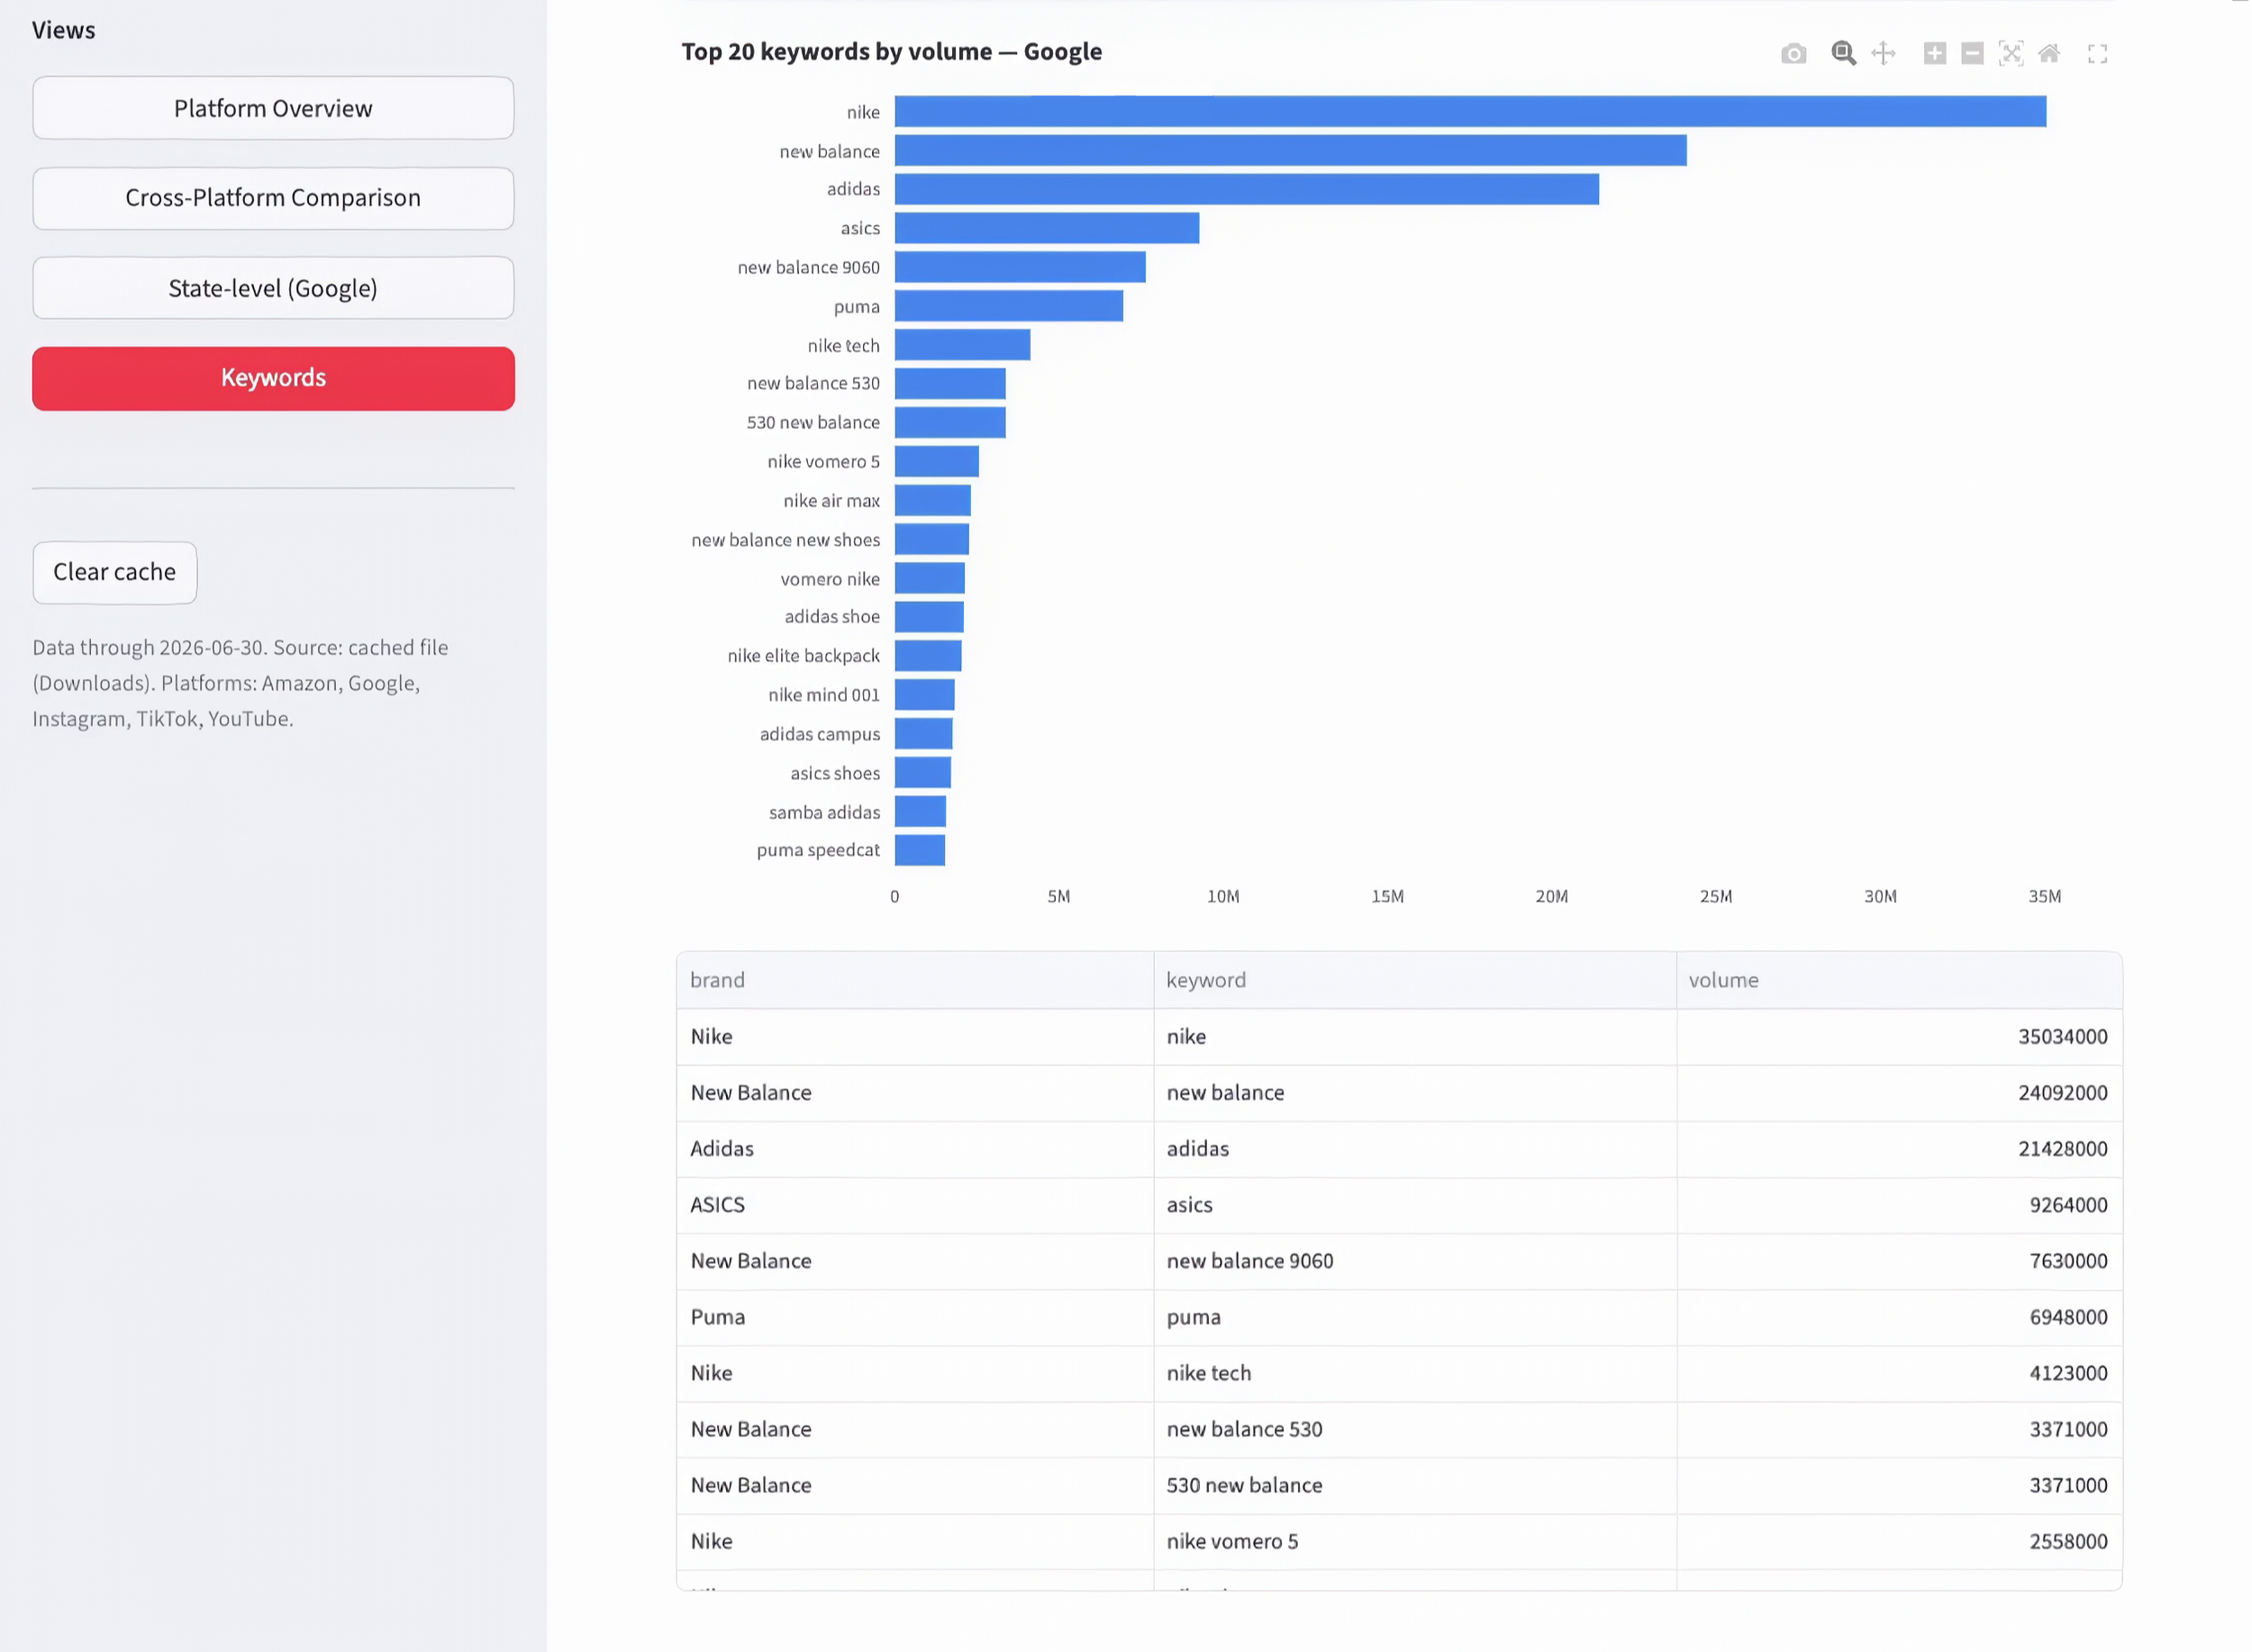
At the keyword level, you can see what the demand is made of. The searches behind the brand name tell you what the demand is actually for. For Puma they cluster on the Speedcat. For New Balance, the 9060 and the 530. That tells you which product is carrying the brand and where to point promotion and inventory. We have a supplements client who uses this to see who is winning magnesium queries specifically inside their competitor set, then adapts the range and the offer to it.
The evidence that it leads money, not just interest
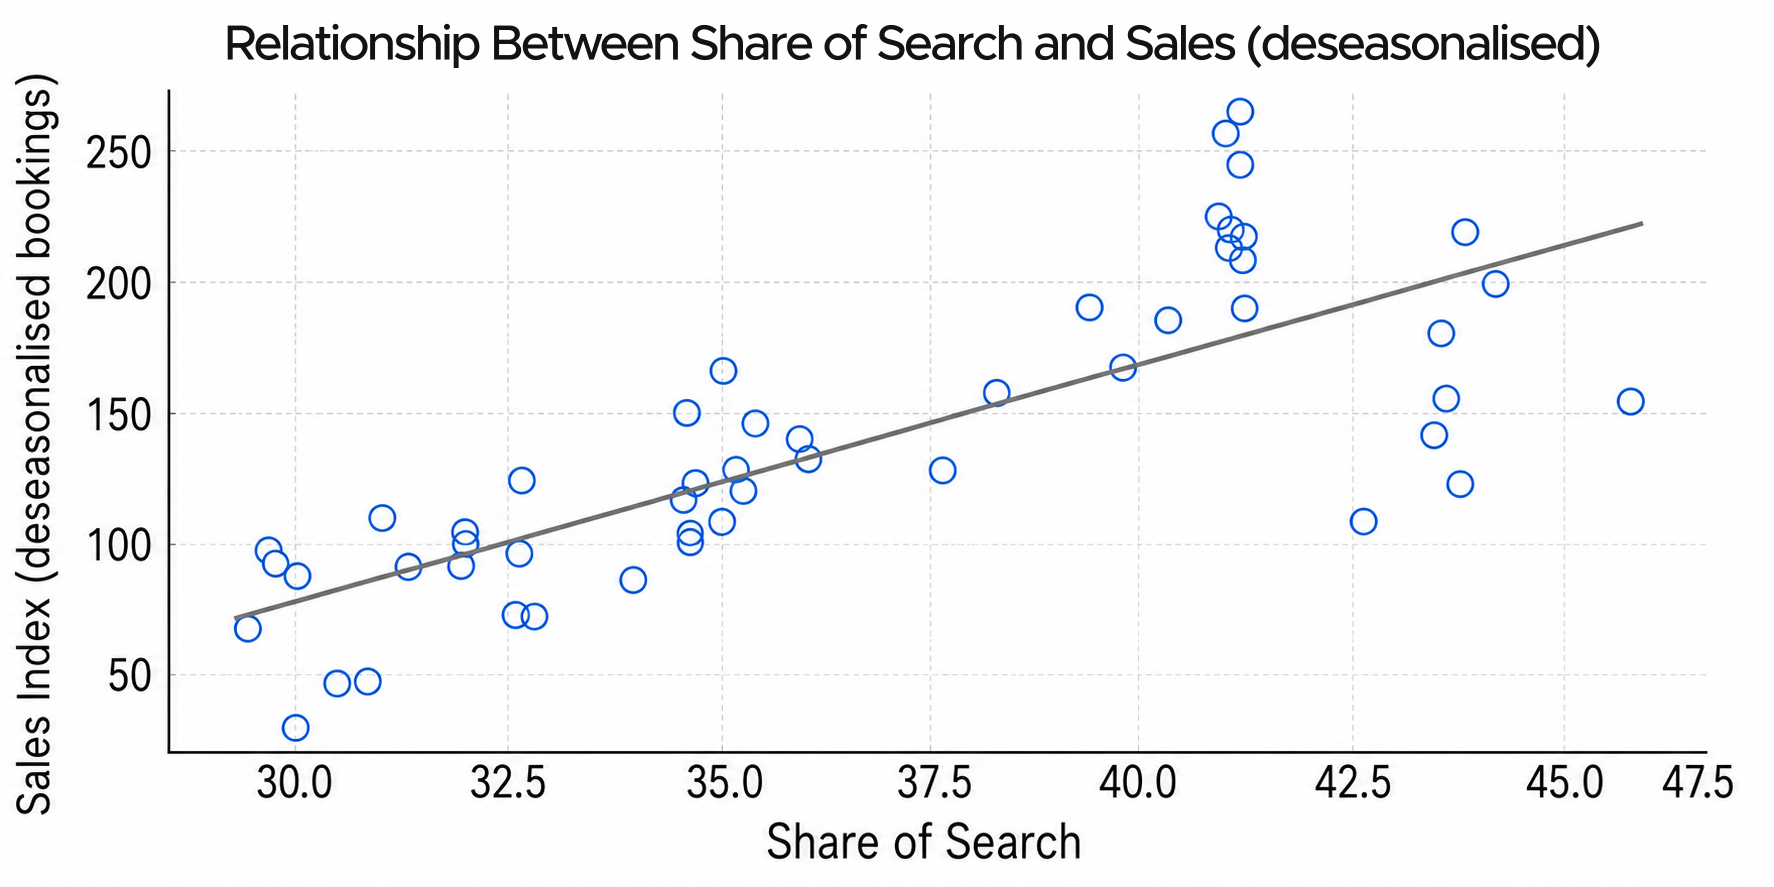
The correlations are one thing. The move is another. One retail client held spend flat and shifted the mix from bottom of funnel toward discoverability. Share of search rose about 15 percent and revenue grew roughly 60 percent over two years. The efficiency of the performance channels improved along the way, but it followed the demand. It did not create it. When more people already have you in mind, your ads convert better, so the platform earns more per impression and wins the auction at a cheaper cost. Cheaper performance is often a symptom of higher share of search, not the cause of growth. The root cause was more people considering the brand before they ever entered the category.
Finance already knows this. Quant funds have used Google search trends to predict retail sales up to three quarters ahead of earnings, and the market does not fully price it in. The signal your dashboard treats as a soft brand metric is one that people who trade on hard numbers take seriously.
This is also why the opposite is dangerous. Push the ROAS target up every year and the easy way to hit it is to spend more on the channels closest to the sale, retargeting, conversion campaigns and brand search, which take credit for buyers who were already yours. The reported number climbs while the real work, making new people willing to buy, goes the other way. The first place that shows up is a flat or falling share of search, months before it reaches revenue.
Reach out for your first read
If you believe this is useful for you you can reach me out at charlie@growthdynamics.dev or book a call on the link below
Related reading
Demand Creation vs Demand Capture: Where Should Your Next Marketing Dollar Go?: Where the next dollar goes when demand has to be created rather than harvested.
Brand Is the Only Marketing Investment That Accumulates: Why created demand compounds while captured demand does not.
Share of Search vs Market Share: How to Measure Whether Preference Is Growing: Public search data shows preference moving before revenue confirms it.
How to Measure Brand Marketing Effectiveness Before Revenue Shows Up: Read the brand effect before the sale arrives to confirm it.
