
How to Measure a Price Change Without an A/B Test
You do not always need an A/B test to measure a price change. You need a credible counterfactual.
A price cut can increase orders and still reduce profit. A price increase can reduce volume and still improve margin. A promotion can look successful because the calendar was strong anyway. A year-over-year read can look positive because the whole business was already growing.
The question is not whether revenue changed after the price move. The question is what would have happened without the price move.
That is why pricing measurement belongs in the same counterfactual logic as marketing incrementality.
Why Pre/Post Is Usually Weak
The first instinct is to compare performance before and after the price change. That is simple, but it is often wrong.
If prices changed before Black Friday, Christmas, a product launch, a competitor promotion, a sales push or a seasonal demand shift, the post-period is contaminated. Revenue may rise because the season always rises. Orders may fall because demand was already softening. A pre/post read cannot separate the price effect from the calendar.
The weakness is logical: the before period is just an earlier period, not a control group.
A business can use pre/post as a quick diagnostic, but it should not use it as proof that the price change worked.
Why Year-Over-Year Is Also Not Enough
Year-over-year comparison helps with seasonality. If the same event happens every year, comparing this year against last year can remove part of the calendar effect.
It introduces another problem: business growth.
If the company was already growing because of more demand, better distribution, stronger brand, improved conversion or higher traffic, this year's event should outperform last year's event even without a price change. A simple year-over-year lift can therefore give credit to the price move for growth that was already happening.
This is why the analysis has to account for both seasonality and baseline growth.
Use Four Numbers
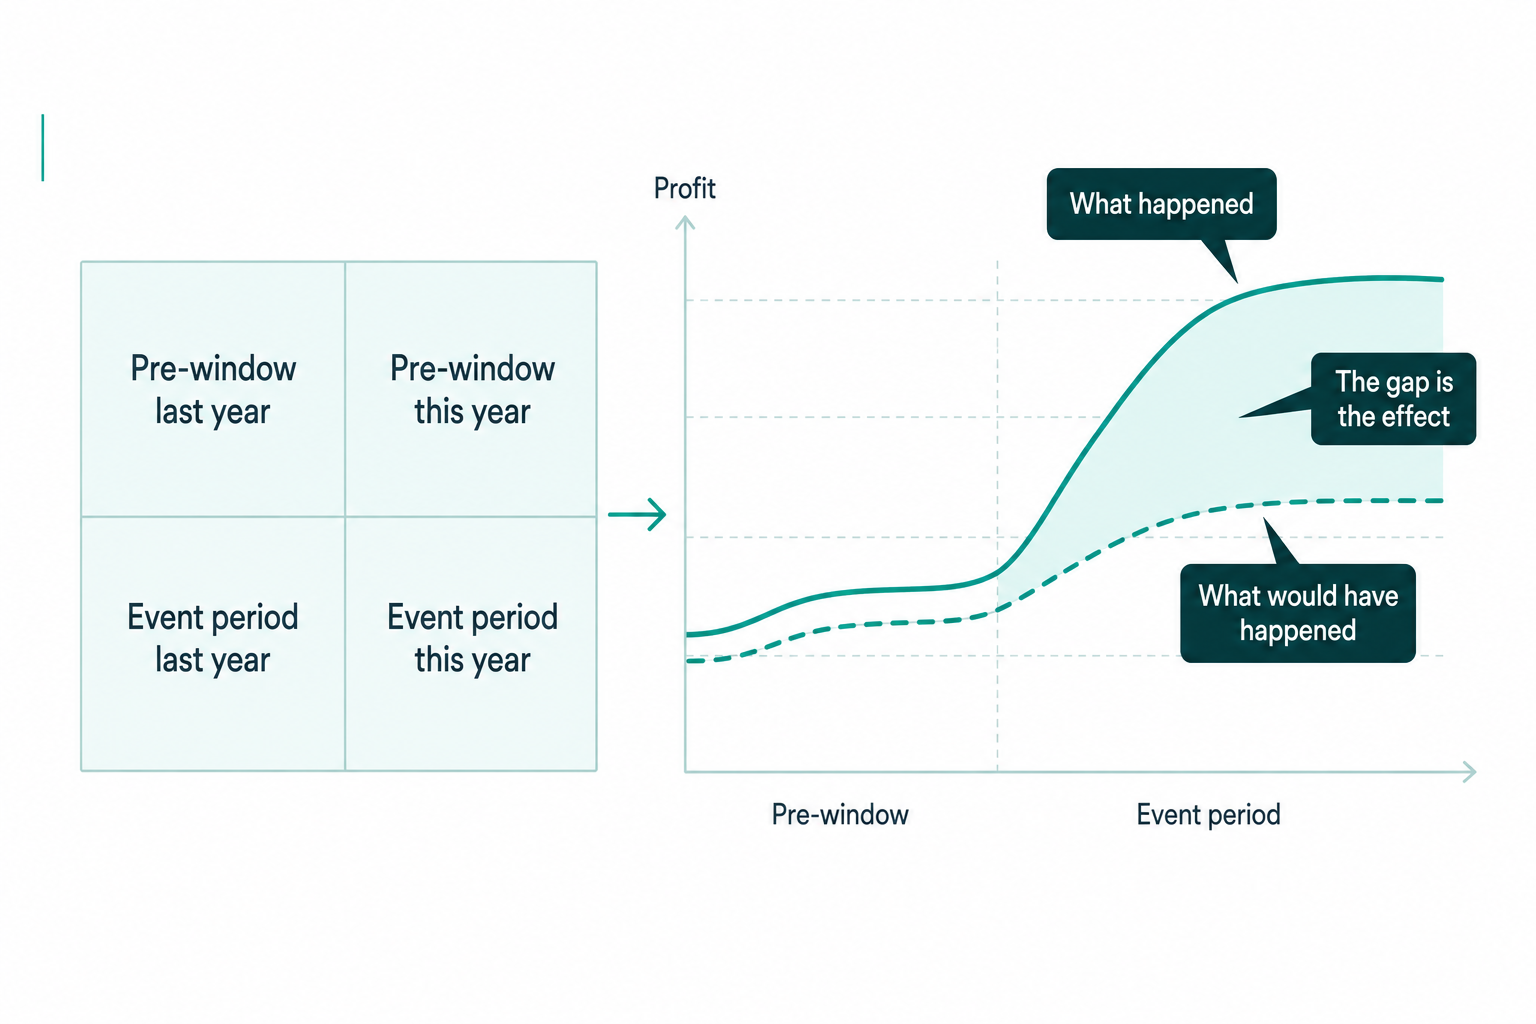
The practical method is a simple Difference-in-Differences structure.
You need four numbers:
1. The pre-window last year.
2. The pre-window this year.
3. The event period last year.
4. The event period this year.
First, calculate the year-over-year growth rate in the pre-window. This is the baseline growth the business was already showing before the price intervention.
Then apply that growth rate to last year's event period. That creates the counterfactual: what this year's event period should have looked like if the business had grown normally and the price change had not happened.
Finally, compare this year's actual event period with the counterfactual. The gap is the estimated price effect.
The method can also be used when a competitor changes price. The intervention date is the competitor move, and the same logic helps estimate whether your sales, margin or volume changed beyond the normal baseline.
Work In Percentages
Absolute order or revenue changes can mislead a growing business.
If the baseline is larger this year, a bigger absolute event result may simply reflect the larger business. What matters is the percentage gap between actual performance and the counterfactual.
This is especially important for promotions. A team may see a large number of extra orders and call the price move a success. If most of those orders were expected from normal growth, the true effect is much smaller.
Working in percentages keeps the analysis from confusing scale with impact.
Measure Gross Profit First
Pricing should usually be judged on gross profit before revenue.
A price cut can create more revenue while reducing gross profit. A lower price may increase volume, but the margin per unit falls. If the extra volume is not large enough to offset the margin compression, the business has created activity rather than value.
Revenue and units are still useful secondary reads. They help explain whether the change affected demand, conversion or volume. But the primary decision is commercial. Did the price move improve profit enough to justify keeping it?
This matters for marketing too. Brand, demand creation and sales execution all affect perceived value. If a company only measures price moves on revenue or lead volume, it can miss the fact that the commercial system is becoming less profitable.
Check For Contamination
Before trusting the result, check what else changed at the same time.
Did marketing spend move? Did a major campaign launch? Did distribution change? Did a competitor change price? Did inventory availability change? Did the sales team change incentives? Did the product mix shift? Did the website or checkout flow change?
Difference-in-Differences helps, but it does not make those issues disappear. The method assumes the pre-window growth rate is a reasonable guide to what would have happened in the event period. If the business context changed sharply, the counterfactual becomes weaker.
The analysis should document those caveats before the result becomes a board-slide conclusion.
The Decision Rule
A pricing read should end with a decision: keep, reverse or refine.
Keep the price change if gross profit improved after accounting for baseline growth, seasonality and known caveats. Reverse it if revenue looked better but gross profit deteriorated. Refine it if the average result hides different effects by product group, customer segment, geography or channel.
The most useful next step is often a split view. Some products may have gained profit from the change while others lost margin. Some customer segments may be more price sensitive than others. Some regions may react differently because competitor pricing differs.
That is where pricing and marketing meet. Price is a finance lever, and it also interacts with brand, perceived value, competitor context and demand quality. Measuring it properly helps the business understand whether growth is coming from stronger demand or cheaper demand.
Related reading
Marketing Measurement Framework: Start With What You Can Observe: Place pricing analysis inside the broader evidence ladder.
How to Measure Marketing Incrementality: A Practical Guide for CMOs: Use the same counterfactual discipline for marketing spend.
Marketing Measurement Data Layer: What You Need Before MMM or Incrementality: Make sure price, product and margin data can be joined before modelling.
How to Measure Brand Marketing Effectiveness Before Revenue Shows Up: Connect perceived value, brand and pricing power.
